Top 6 AI Report Generators in 2025: A Practical Comparison for Modern Teams
From data exploration to presentation, how today’s AI tools actually fit real reporting workflows

Introduction
AI report generators have become a common category across analytics, design, and productivity tools. Nearly every platform now claims to help teams “create reports faster,” but in practice, these tools approach the problem from very different angles.
Some focus on analyzing structured data. Others prioritize visual presentation or narrative writing. As a result, comparing AI report generators purely by features often leads to misleading conclusions.
This article takes a practical, side-by-side look at several widely used AI report generators in 2025, highlighting what each tool does well, where it has limitations, and which types of users it is best suited for.
What Is an AI Report Generator?
In most business contexts, an AI report generator refers to software that uses large language models and related AI techniques to assist with one or more stages of reporting:
Interpreting data or source material
Summarizing key points or trends
Structuring content into a report format
Generating charts, visuals, or presentations
Importantly, not all tools cover the full reporting workflow. Some are optimized for data analysis, others for design or storytelling. Understanding this distinction is essential when evaluating which tool fits a specific use case.
With that framework in mind, the following section reviews six AI report generators commonly used by business and knowledge teams today, starting with Powerdrill Bloom.
Tool-by-Tool Comparison
1. Powerdrill Bloom
Positioning: AI-powered data exploration and reporting
Focus: From raw data to insight to presentation
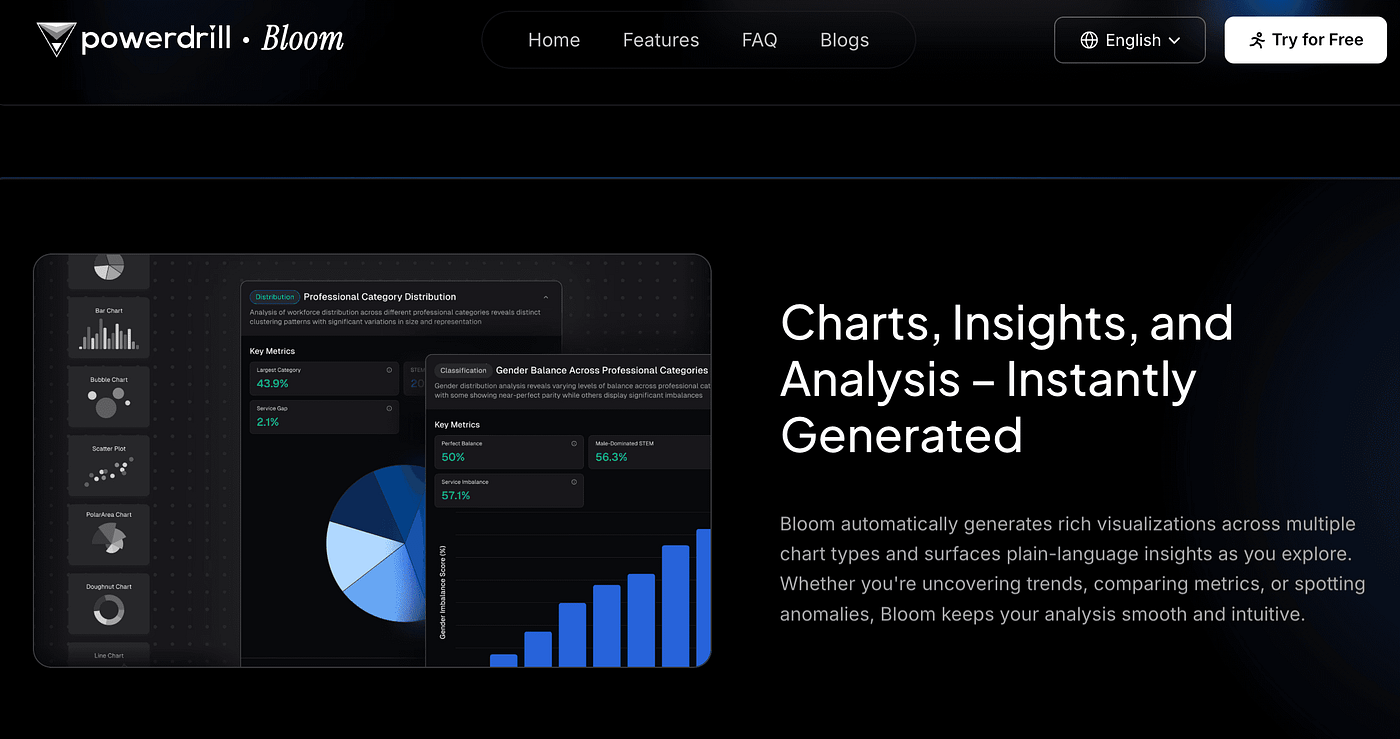
Powerdrill Bloom approaches reporting as an interactive dialogue with your data, not a static export process.
Users can upload Excel or CSV files — or start with a business question — and explore the data using natural language. Instead of manually building pivot tables or charts, Bloom generates analyses, comparisons, and visualizations as part of the conversation.
Where it differentiates itself is in how it handles the end of the workflow.
With Nano Banana Pro, insights don’t stop at charts or summaries. Bloom converts analysis results directly into clean, professional, presentation-ready slides.
Best suited for
Business analysts and strategy teams
Marketing and operations teams working with recurring reports
Managers who need fast, defensible insights
Why choose it
You want a single tool for analysis and reporting
Your work starts with real data, not just text
You care about speed without sacrificing clarity
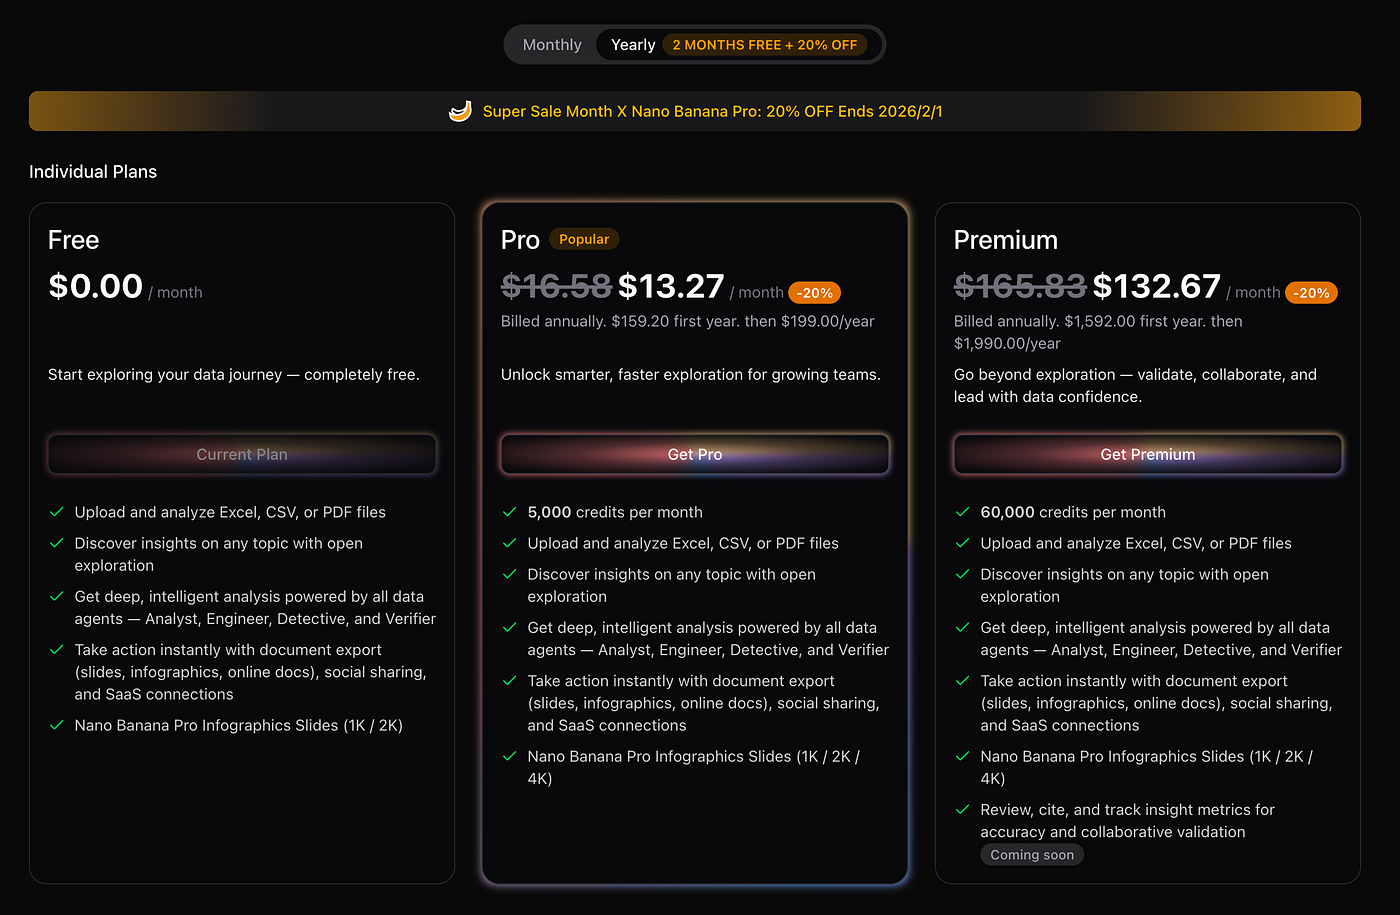
Pricing
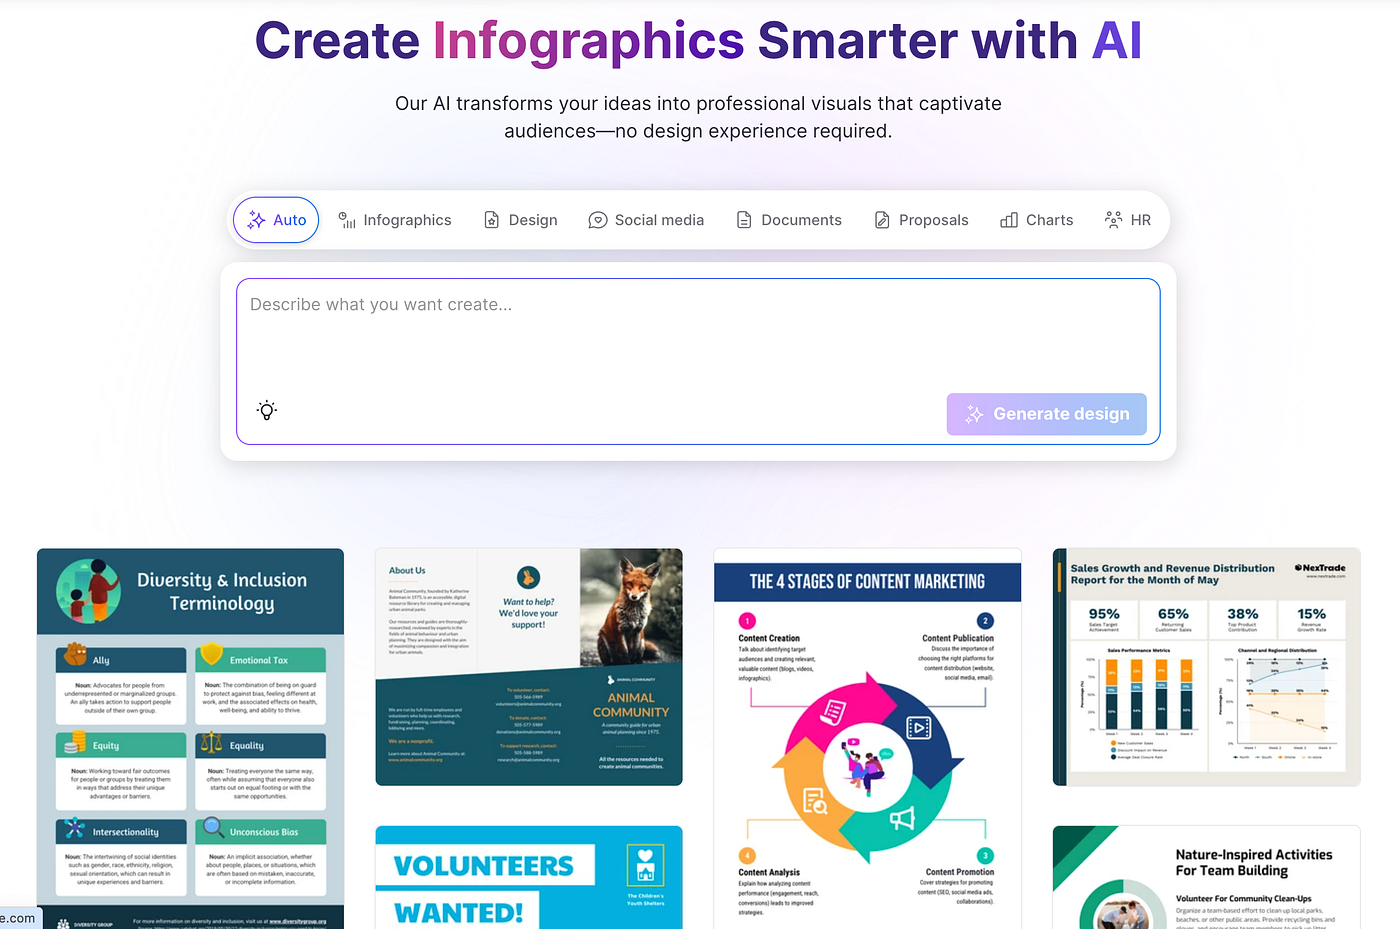
2. Piktochart AI
Positioning: Visual-first AI report generator
Focus: Making reports easy to read and share
Press enter or click to view image in full size
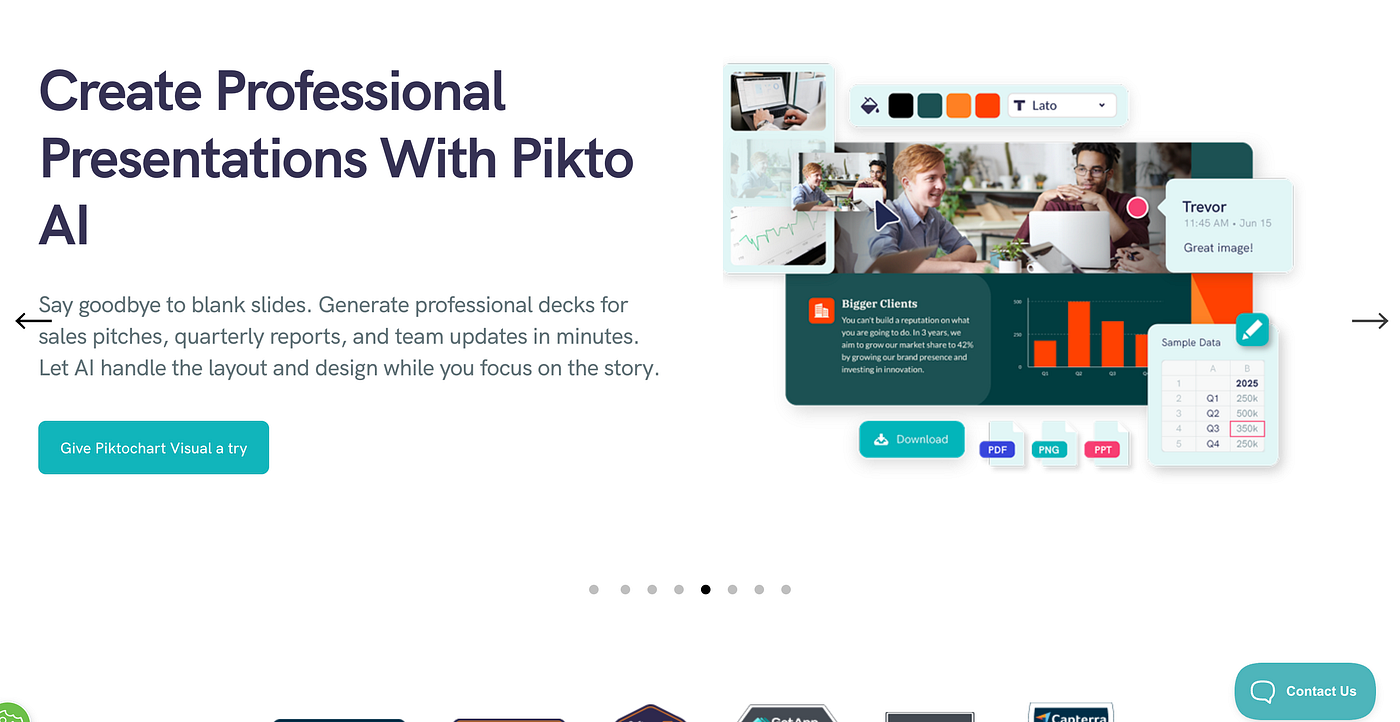
Piktochart AI is built for teams who already understand their message but need help turning it into a clear, visually engaging report.
It works best when content is relatively straightforward — summaries, performance overviews, educational or marketing reports — and when visual communication matters more than deep analysis.
Limitations
Minimal analytical depth
Heavily template-driven outputs
Best suited for
Marketing and communications teams
Educators and trainers
Non-technical users
Why choose it
Visual clarity is the priority
Reports are meant to be skimmed, not dissected
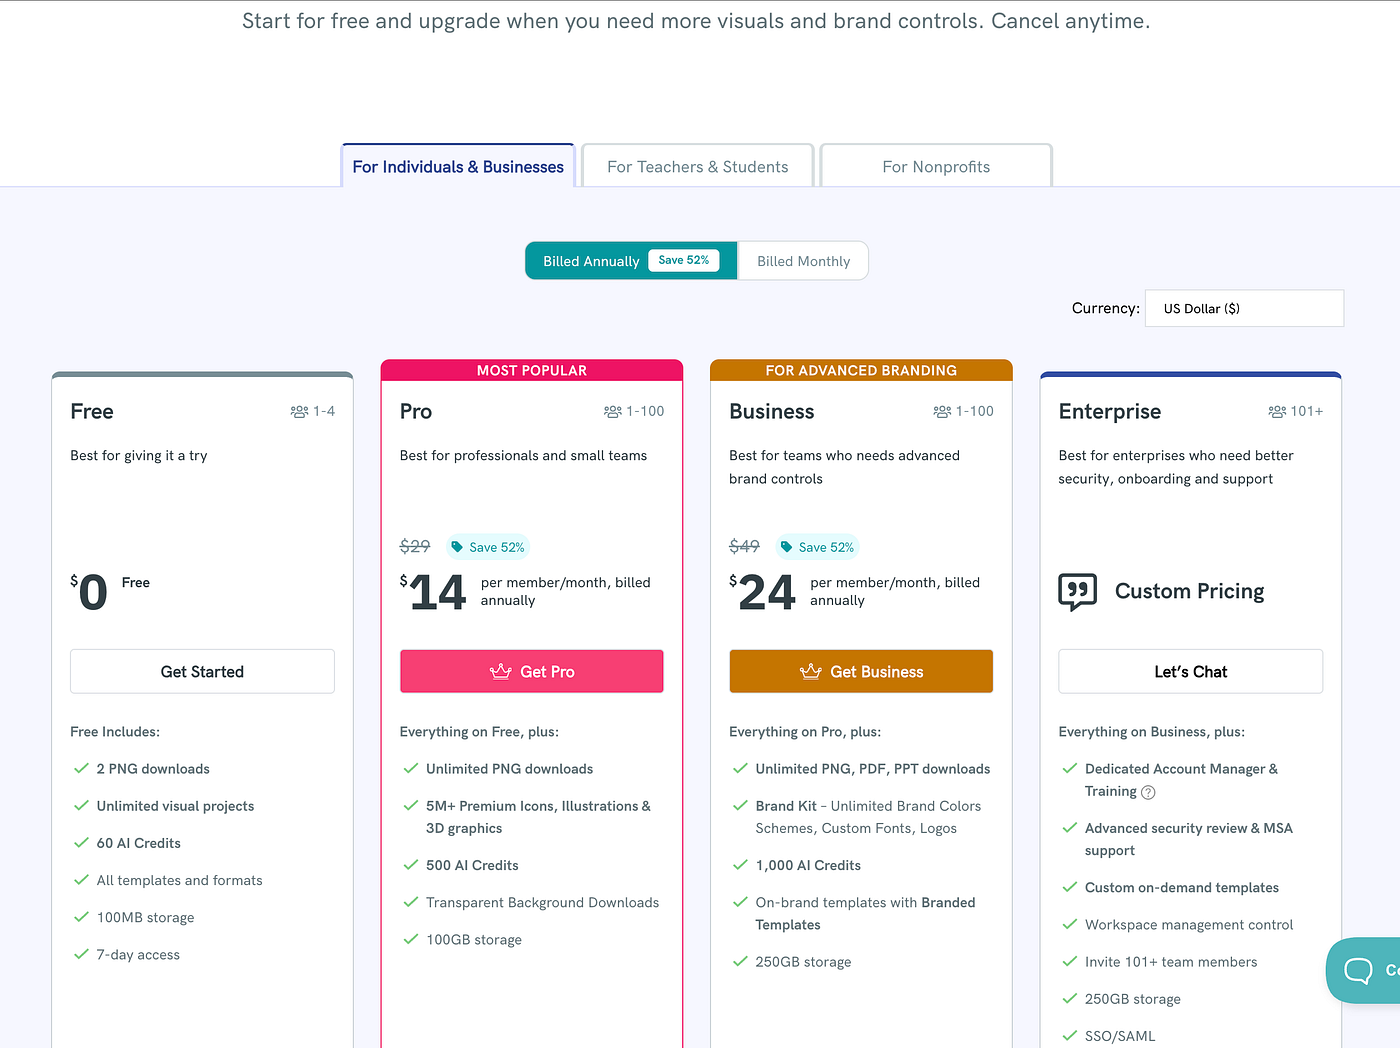
Pricing
3. Venngage
Positioning: Template-driven business reporting
Focus: Consistency and brand alignment
Venngage AI sits between writing and design. It helps generate structured report drafts and applies consistent branding across layouts.
Compared to Piktochart, it feels more business-oriented, but it still assumes that insights already exist.
Limitations
AI-generated content is relatively high-level
Not designed for complex datasets
Best suited for
Small businesses and startups
HR and internal communications teams
Agencies producing client-facing summaries
Why choose it
Brand consistency matters
Reports follow repeatable formats
Pricing
4. Visme
Positioning: All-in-one content and design platform
Focus: Flexible report creation
Visme AI offers more control than pure template tools. Users can generate report drafts, customize layouts, and mix content types more freely.
It works well when reports serve multiple purposes — part analysis, part presentation.
Limitations
Less automation in insight discovery
Can feel heavy for simple reporting needs
Best suited for
Consultants and freelancers
Product and growth teams
Why choose it
You want flexibility over automation
Reports double as marketing assets
Pricing
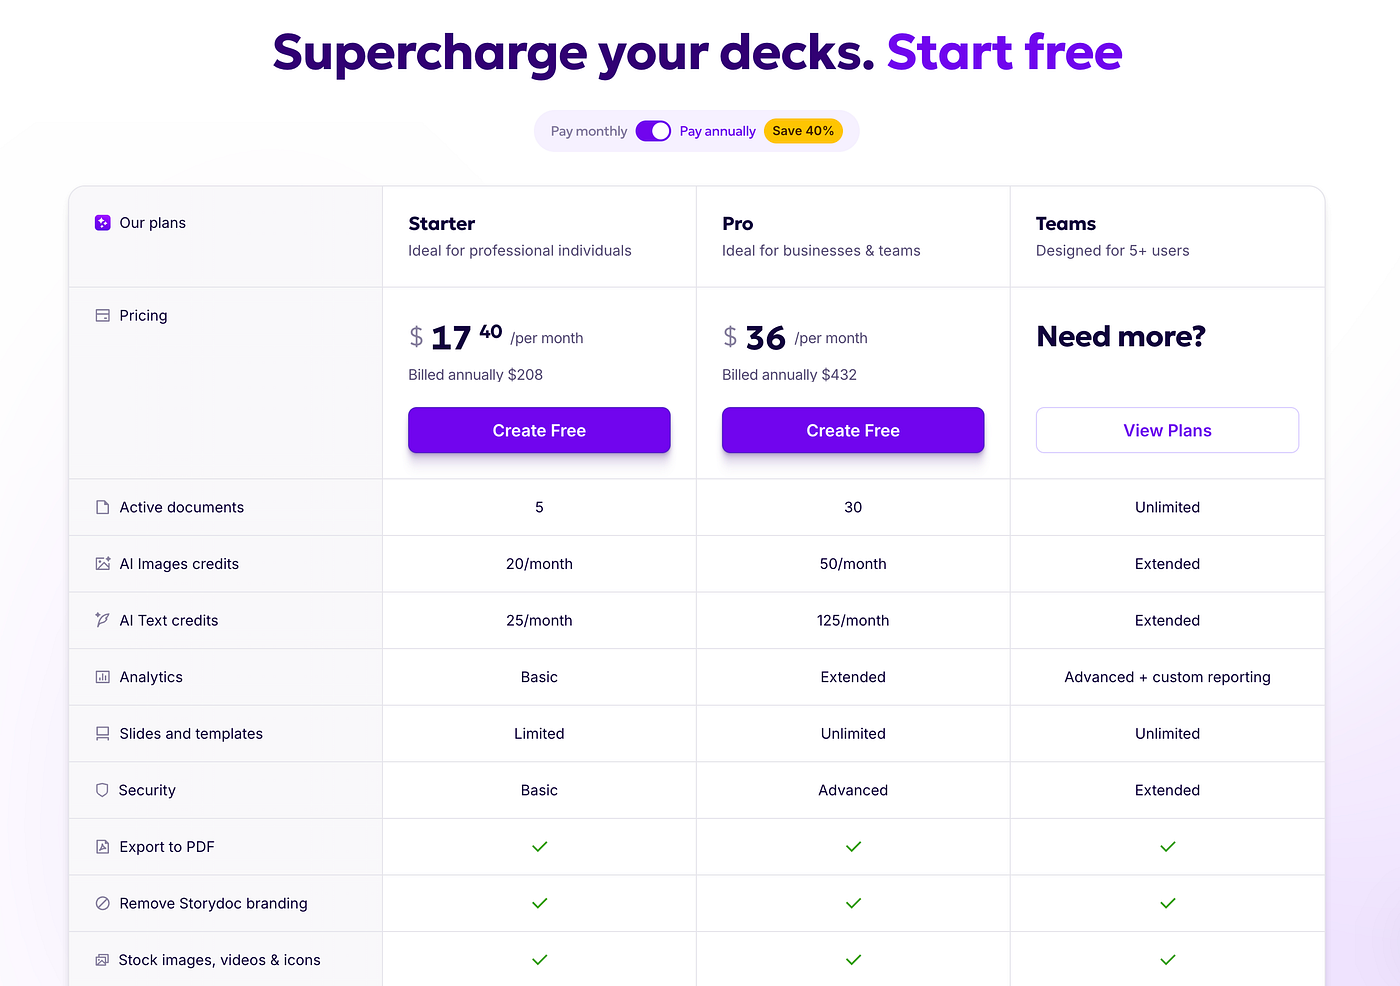
5. Storydoc
Positioning: Interactive, web-based reports
Focus: Engagement and storytelling
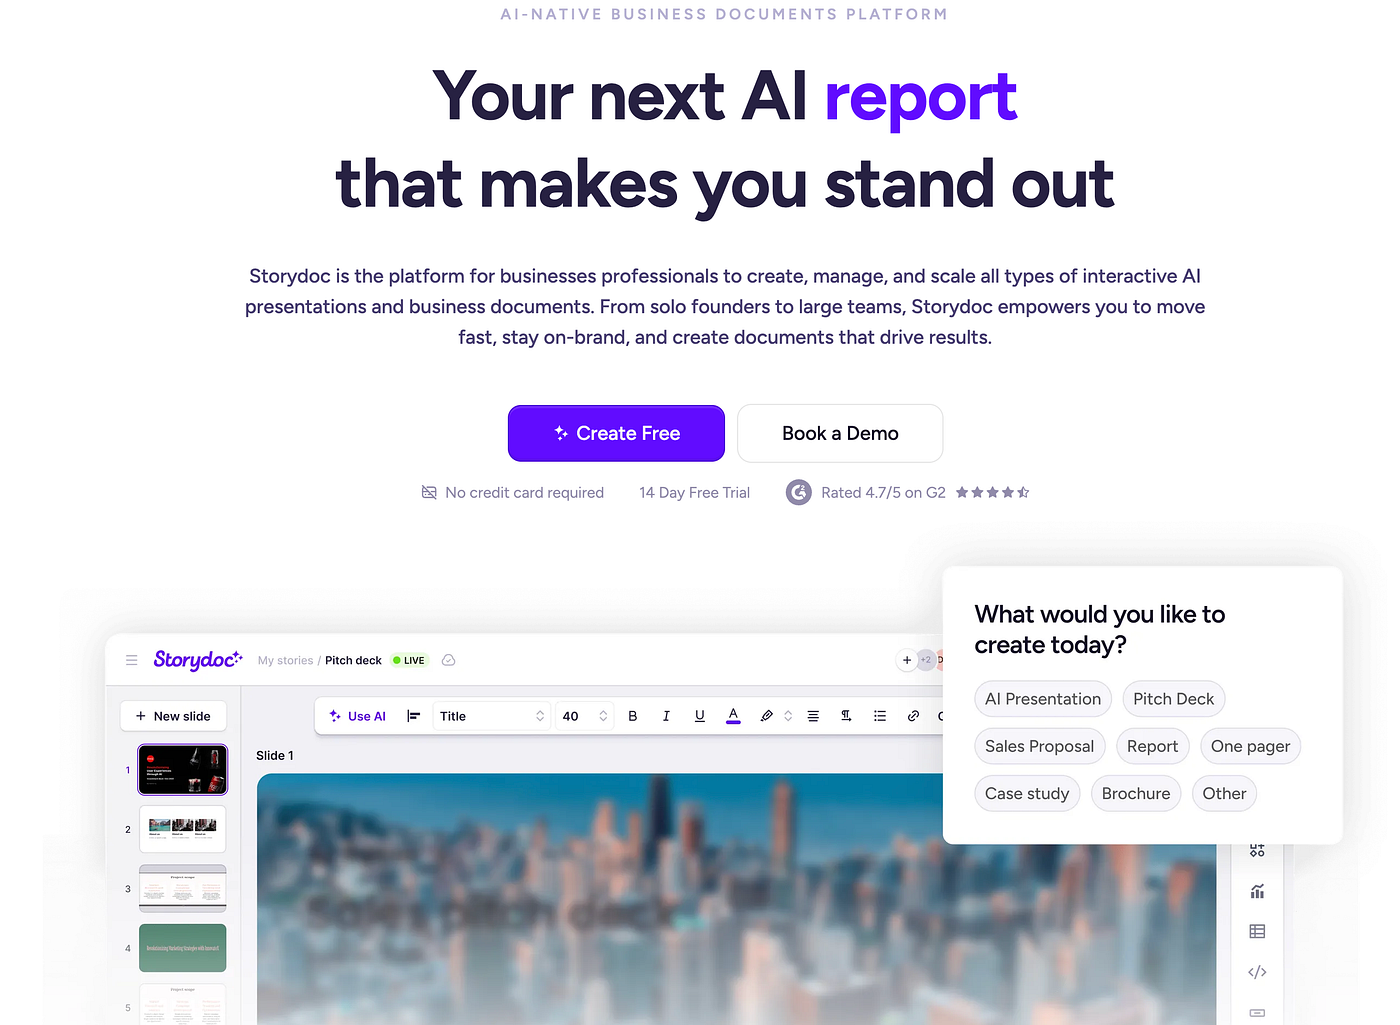
Storydoc treats reports as experiences rather than documents. Its strength lies in interactive, scroll-based reports designed to keep readers engaged — especially in sales or client-facing contexts.
Data analysis is not the core value here; storytelling is.
Limitations
Not built for data-heavy analysis
Less suitable for internal operational reporting
Best suited for
Sales and customer success teams
Founders and agencies presenting to clients
Why choose it
Engagement matters more than depth
Reports are part of a conversation
Pricing
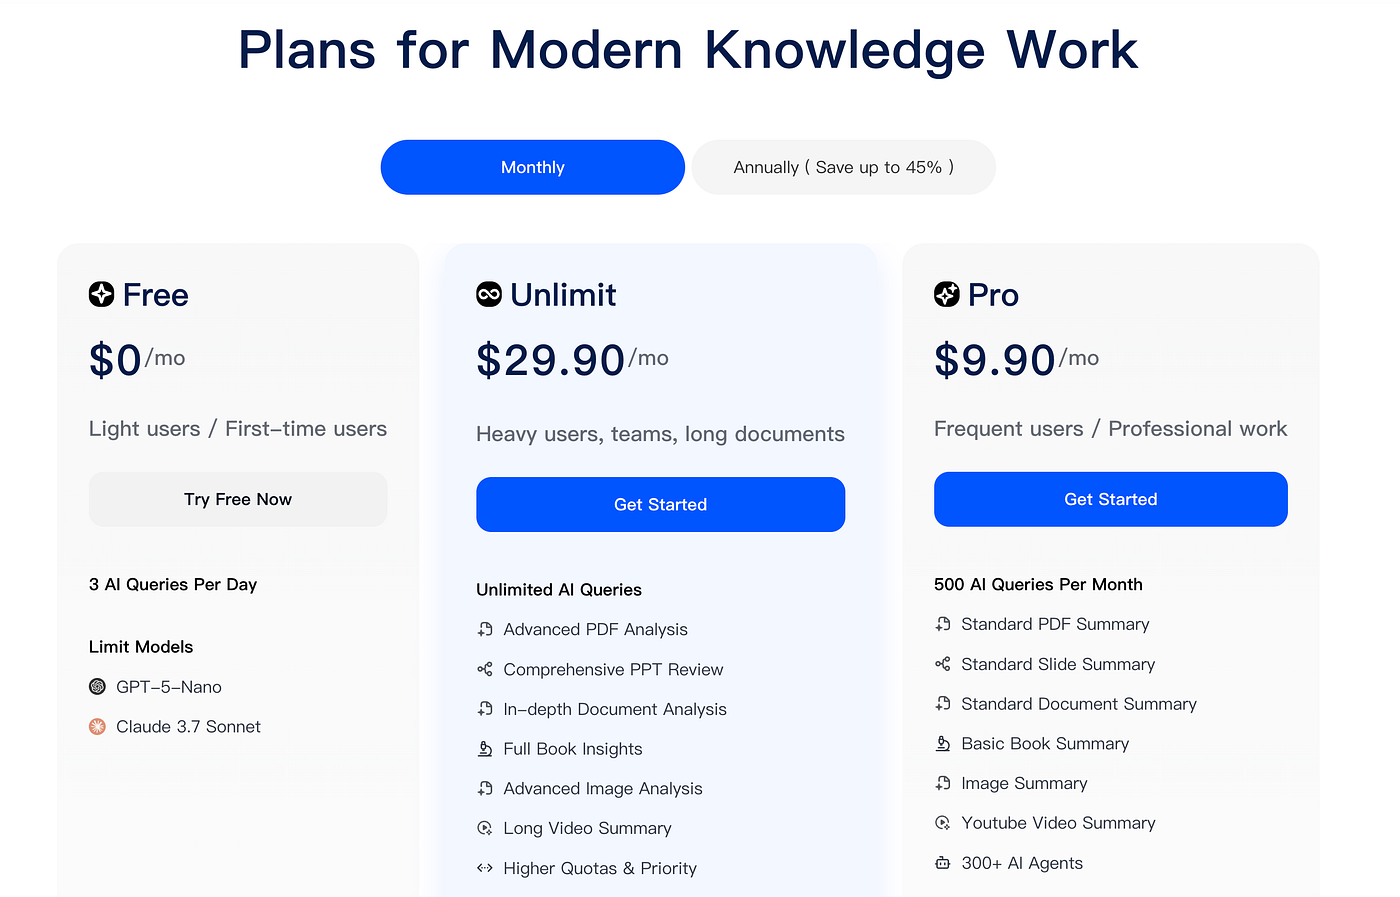
6. iWeaver
Positioning: Document-based AI report generation
Focus: Turning existing documents into structured reports
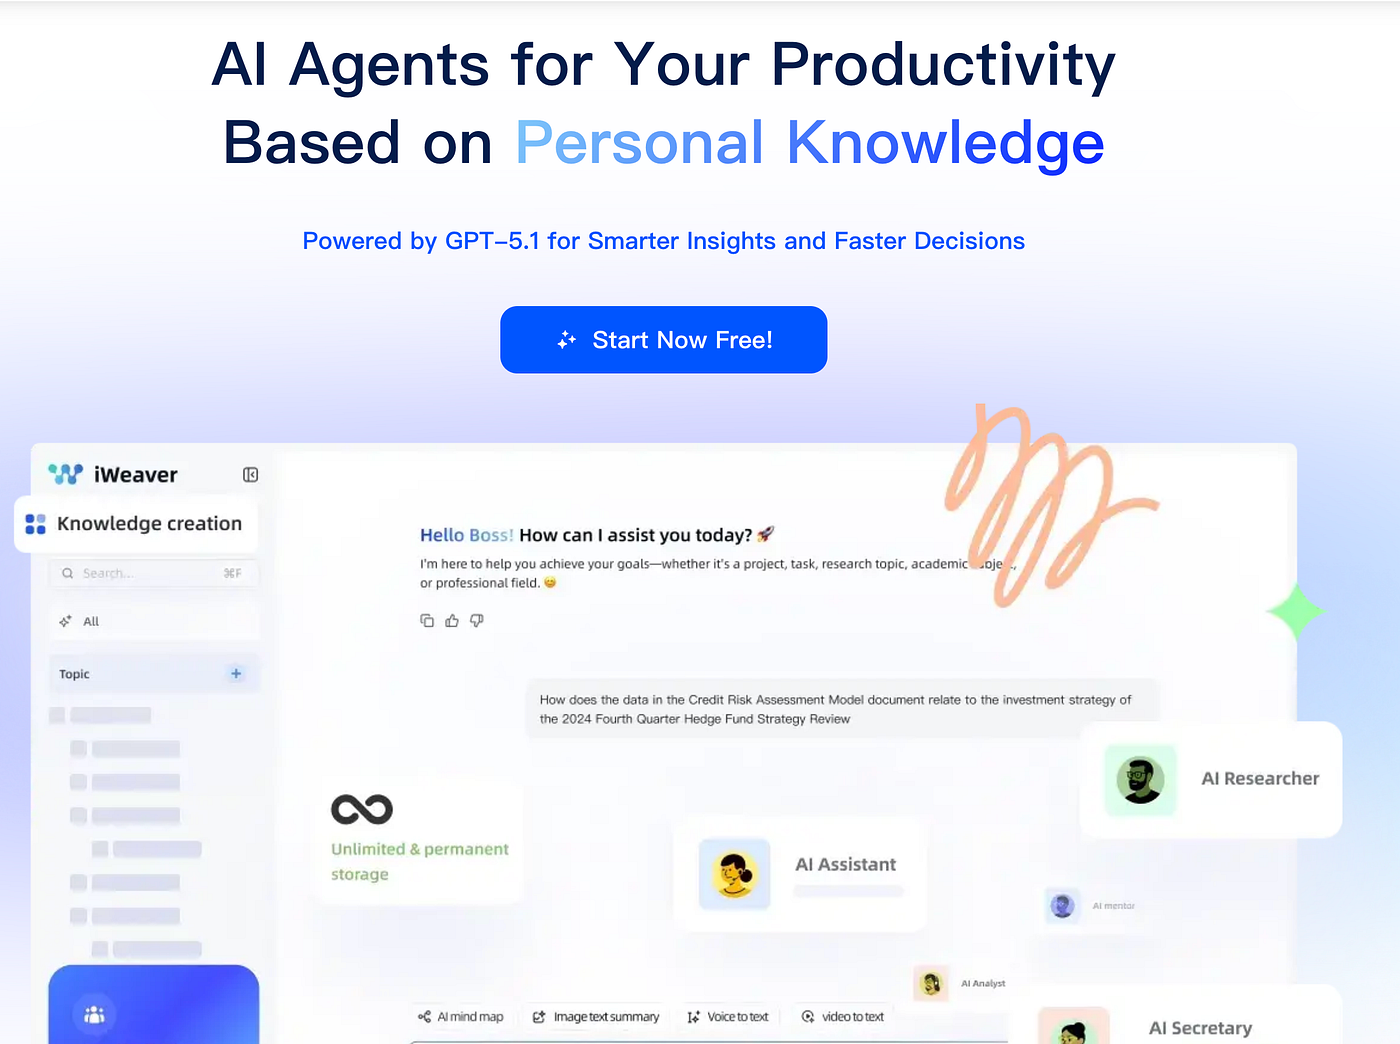
Instead of starting with raw datasets or blank prompts, iWeaver is built around existing documents — PDFs, Word files, spreadsheets, and internal materials. Its strength lies in extracting key points, reorganizing information, and producing structured reports from content that already exists.
This makes it particularly useful in environments where reporting is documentation-heavy rather than analysis-heavy.
Limitations
Limited support for deep data exploration
Visual output is relatively basic compared to design-first tools
Best suited for
Research teams and analysts working with large document sets
Compliance, policy, or consulting teams
Organizations with strong documentation workflows
Why choose it
Your reports are derived from existing documents
Structure and clarity matter more than visualization
Pricing
Conclusion
AI report generators are no longer about replacing writing — they’re about removing friction from reporting workflows.
Some teams need better visuals. Some need clearer structure. Others need help turning messy inputs into something usable.
The right tool depends less on features and more on where your reporting process slows down.
If your work revolves around documents, tools like iWeaver make sense.
If communication and engagement are the goal, Storydoc or Piktochart fit naturally.
If consistency and repeatability matter, Venngage and Visme provide reliable structure.
For teams whose reporting starts with raw data and ends with decisions, tools that connect analysis and presentation in a single flow — such as Powerdrill Bloom — reflect where this category is heading.
In 2025, the most valuable AI report generators won’t feel like “AI tools” at all.
They’ll simply make reporting feel lighter, faster, and more intentional.


